Introduction
DAT is a MATLAB-based software package for dense seismic array data processing and imaging. No dependency is required. You can run the program directly after downloading the source code without any warning.
In the ./demo/ directory, we provide some examples to show how to use DAT. We provide two presentive array geometries: linear array and distributed array. Array data is stored in the ./data/ directory. You can also use your own array data by following the same format (for details, please refer to Getting started).
Examples
1. RF Stacking:
clc;clear;close all;
%% 0. Setup Paths and Parameters
config = loadConfig();

dataFolder         = config.dataFolder;
PreprocessingParam = config.PreprocessingParam;
DeconvParam        = config.DeconvParam;

%% 1. Read Data
DataStruct = read_SAC(dataFolder);

%% 2. Preprocessing
DataStruct = preprocessing(DataStruct, PreprocessingParam);

%% 3. Compute Receiver Functions
DataStruct = deconv(DataStruct, DeconvParam);

%% 4. Stack Receiver Functions from all events
[seisout, depth0, mohoStruct] = stackCommonStationGather(DataStruct);

%% 5. Visualization
% 5.1 Visualize example single seismic trace
trace_index = 100;  % Specify the index of the trace to plot
plotWaveforms(DataStruct, trace_index);

% 5.2 Visualize receiver functions for a specific station
station = getStations(DataStruct);
stationList = {station.sta};
station = stationList{1};  % Select the first station for demonstration
plotCommonStationGather(DataStruct, station);

% 5.3 Visualize receiver functions for all events
event     = getEvents(DataStruct);
eventList = {event.evid};
for iEvent = 1:length(eventList)
    EventID = eventList{iEvent};
    % Extract seismic records corresponding to this event
    gather = getCommonEventGather(DataStruct, EventID);

    plotCommonEventGather(DataStruct, EventID, 'trace','wigb');

    % Save current figure as PNG file with 150 dpi resolution
    % export_fig(['./figures/', EventID, '.png'], '-r150');

    close all
end
% 5.4 Visualize station and event distribution on map
plotStations(DataStruct, 'Baiyanebo_DEM.mat');

%   plotEvents() plots event location distribution
plotEvents(DataStruct);
2. Rank Reduction Method:
clear; clc; close all;
%% 0. Load configuration parameters for all processing steps
config = loadConfig();

% Define data folder containing SAC waveform files
dataFolder = '../data/event_waveforms_BY';

% Extract processing parameters from configuration
PreprocessingParam = config.PreprocessingParam;  % Data preprocessing settings
DeconvParam        = config.DeconvParam;         % Receiver function computation
RankReductionParam = config.RankReductionParam;  % Rank reduction parameters

%% 1. Read Seismic Data
fprintf('\n[Step 1] Reading SAC waveform data from: %s\n', dataFolder);
DataStruct = read_SAC(dataFolder);
if isempty(DataStruct)
    error('No seismic data found in %s. Please check the data folder path.', dataFolder);
end

%% 2. Data Preprocessing
fprintf('\n[Step 2] Preprocessing seismic data...\n');
DataStruct = preprocessing(DataStruct, PreprocessingParam);
fprintf('   Preprocessing completed successfully\n');

%% 3. Receiver Function Computation
fprintf('\n[Step 3] Computing receiver functions using iterative deconvolution...\n');
DeconvParam.verbose = false;  % Suppress detailed output for cleaner demo
DataStruct = deconv(DataStruct, DeconvParam);
fprintf('   Receiver function computation completed\n');

%% 4. Rank Reduction Processing (DRR-OTG Method)
fprintf('\n[Step 4] Applying rank reduction (DRR-OTG) for signal enhancement...\n');

% Define 3D grid parameters for spatial reconstruction
dx = 10;    % Grid spacing in x-direction (km)
dy = 10;    % Grid spacing in y-direction (km)
dz = 1;     % Grid spacing in z-direction (depth, km)
zmax = 100; % Maximum depth for imaging (km)
xpad = 50;  % Padding in x-direction for boundary handling (km)
ypad = 50;  % Padding in y-direction for boundary handling (km)

% Create regular grid structure for spatial reconstruction
gridStruct = createGrid(DataStruct, dx, dy, dz, zmax, xpad, ypad);

% Get list of unique seismic events in the dataset
eventList = getEvents(DataStruct);
eventIDs  = {eventList.evid};

% Initialize structure for storing rank-reduced results
DataStructDRR = [];
minStationCount = 50;  % Minimum stations per event for reliable rank reduction

% Process each event individually
for iEvent = 1:length(eventIDs)
    evid = eventIDs{iEvent};

    % Extract all receiver functions for current event
    [gather, matchIndex] = getCommonEventGather(DataStruct, evid);

    % Skip events with insufficient station coverage
    if length(gather) < minStationCount
        fprintf('   Event %s: Only %d stations (minimum %d required) - Skipping\n', ...
            evid, length(gather), minStationCount);
        continue;
    end

    fprintf('   Processing event %s with %d stations...\n', evid, length(gather));

    % Apply 3D rank reduction using DRR-OTG method
    [gatherReconstructed, d1_otg] = rankReduction3D(gather, gridStruct, RankReductionParam);

    % Store reconstructed receiver functions
    DataStructDRR = [DataStructDRR; gatherReconstructed(:)];
end

% Transpose results to match original DataStruct format
DataStructDRR = DataStructDRR';
fprintf('   Rank reduction completed for %d events\n', length(DataStructDRR));

%% 5. Stack Receiver Functions
fprintf('\n[Step 5] Stacking receiver functions by station...\n');
% Stack common station gathers to improve signal-to-noise ratio
% - Aligns receiver functions from different events for each station
% - Averages aligned traces to suppress random noise
% - Produces high-quality station stacks for imaging
[seisout, depth0, mohoStruct] = stackCommonStationGather(DataStructDRR);
3. 2D Least-squares Migration:
clear; clc; close all;
clear; clc; close all;
%% 0. Load configuration parameters for all processing steps
config = loadConfig();
dataFolder = '../data/event_waveforms_QBI';
PreprocessingParam = config.PreprocessingParam;
MigParam = config.MigParam;
RadonParam = config.RadonParam;
DeconvParam = config.DeconvParam;
CCPParam = config.CCPParam;
%% 1. Read data
DataStruct = read_SAC(dataFolder);
%% 2. Preprocessing
DataStruct = preprocessing(DataStruct, PreprocessingParam);
%% 3. Get array and event information
stationList = getStations(DataStruct);
eventList = getEvents(DataStruct);
stlo = [stationList.stlo]'; % Station longitude (degrees)
stla = [stationList.stla]'; % Station latitude (degrees)
evla = [eventList.evla]'; % Event epicenter latitude (degrees)
evlo = [eventList.evlo]'; % Event epicenter longitude (degrees)
% Filter events based on azimuthal consistency to ensure 2D approximation validity
idxConsistentEQ = filter_earthquakes_by_azimuth(stlo, stla, evlo, evla, config.max_angle_diff);
eventid = {eventList.evid};
eventid = eventid(idxConsistentEQ);
EventStationTable = getEventStationTable(DataStruct);
%% 4. Create velocity model
dx = 4; % Horizontal grid spacing in x-direction (km)
dy = 4; % Horizontal grid spacing in y-direction (km)
dz = 1; % Vertical grid spacing (km)
zmax = 100; % Maximum depth for imaging (km)
xpad = 40; % Padding distance beyond array extent in x-direction (km)
ypad = 40; % Padding distance beyond array extent in y-direction (km)
gridStruct = createGrid(DataStruct, dx, dy, dz, zmax, xpad, ypad);
gridStruct = getVelocityModel('2D',gridStruct);
%% 5. Migration imaging
migResults = []; % Array to store migration results from all events
ccpResults = []; % Array to store CCP stacking results from all events
nMigratedEvents = 0; % Counter for successfully processed events
minTrace = 50;
for iEvent = 1:length(eventid)
evid = eventid{iEvent}; % Current event ID
gather = getCommonEventGather(DataStruct, evid);
if length(gather) < minTrace
continue % Skip to next event if insufficient stations
end
DeconvParam.gauss = 2.5; % Gaussian width parameter for frequency filtering
DeconvParam.verbose = false; % Suppress verbose output during processing
gather = deconv(gather, DeconvParam);
% Apply Radon Transform for enhanced signal-to-noise ratio
RadonParam.highs = 1.2; % High-slowness cutoff (s/km)
RadonParam.pmax = 0.02; % Maximum slowness (s/km)
RadonParam.pmin = -0.02; % Minimum slowness (s/km)
gatherRadon = radonTransform2D(gather, gridStruct, RadonParam);
% Perform 2D Common Conversion Point (CCP) stacking
CCPParam.imagingType = '2D'; % Set imaging mode to 2D
CCPParam.smoothLength = 0; % No additional smoothing applied
ccpResult = CCPCommonEventGather(gatherRadon, gridStruct, CCPParam);
ccpResults = [ccpResults; ccpResult]; % Accumulate CCP results
% Perform least-squares migration for improved resolution
MigParam.itermax = 30; % Maximum iterations for convergence
MigParam.gauss = DeconvParam.gauss; % Use same Gaussian parameter as deconvolution
migResult = leastSquaresMig2D(gatherRadon, gridStruct, MigParam);
% Store migration results for current event
migResults = [migResults; migResult]; % Accumulate migration results
% Update event counter for progress tracking
nMigratedEvents = nMigratedEvents + 1;
end
%% 6. Visualization
smoothLength = 3; % Smoothing parameter for display (grid points)
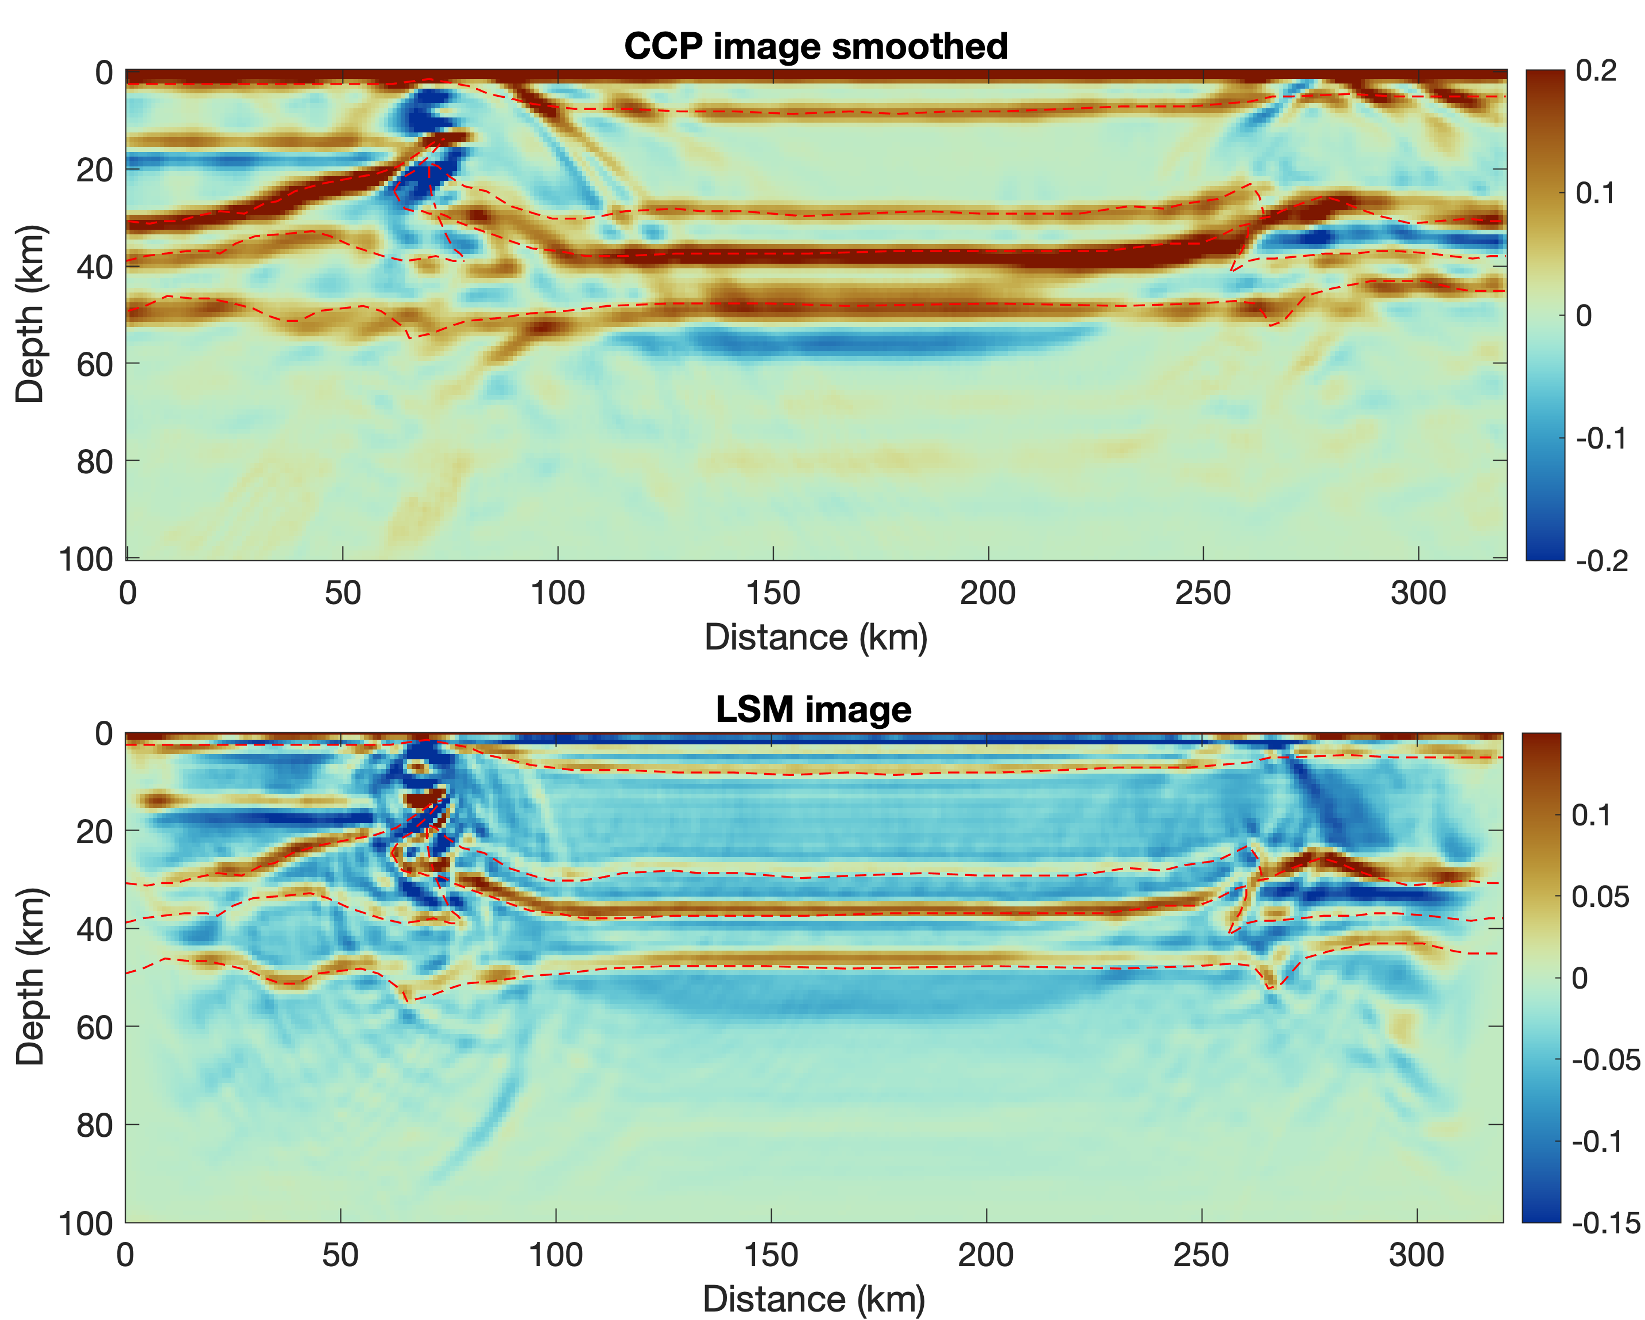
plotCCPMigrationResults(ccpResults, migResults, gridStruct, smoothLength);
%% 7. Save results
write_MigResult([config.outputFolder, '/migResults.mat'], migResults);
write_MigResult([config.outputFolder, '/ccpResults.mat'], ccpResults);
Synthetic experiments of LSM
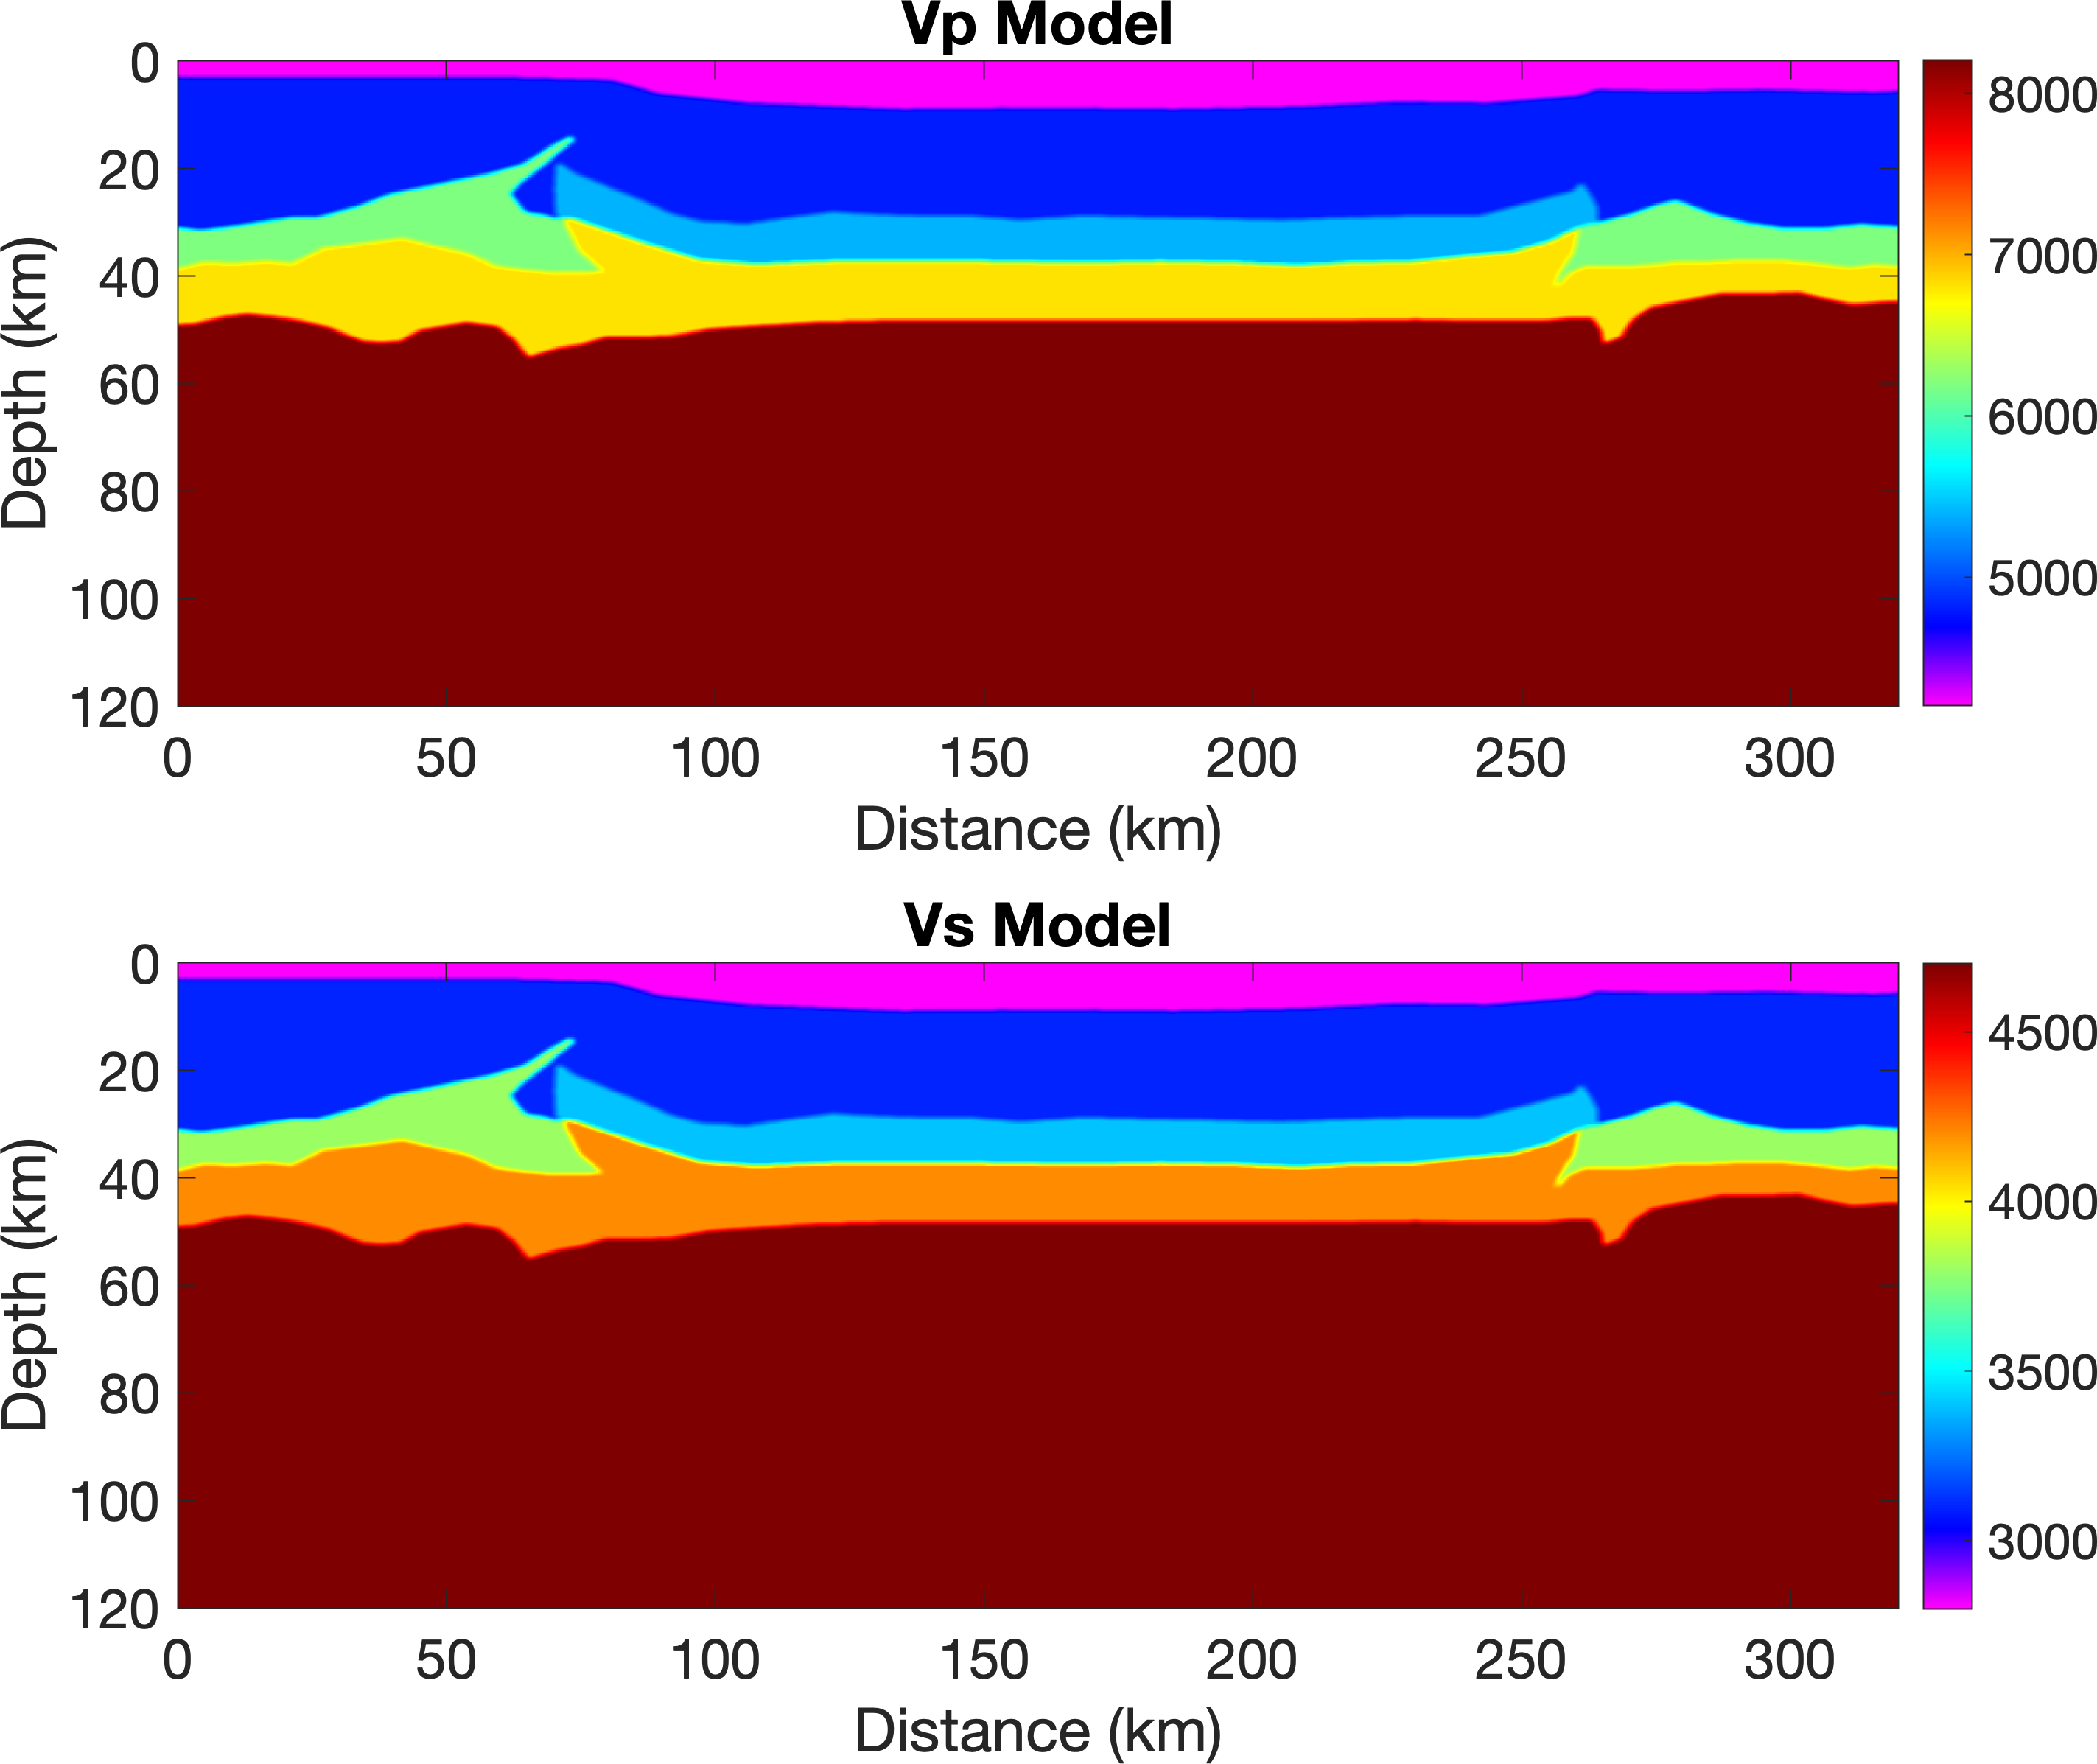
1. Velocity model
We generate a 2D benchmark model with complex subsurface structures. The velocity model is obtained from basin-mountain compressional geodynamics modeling.
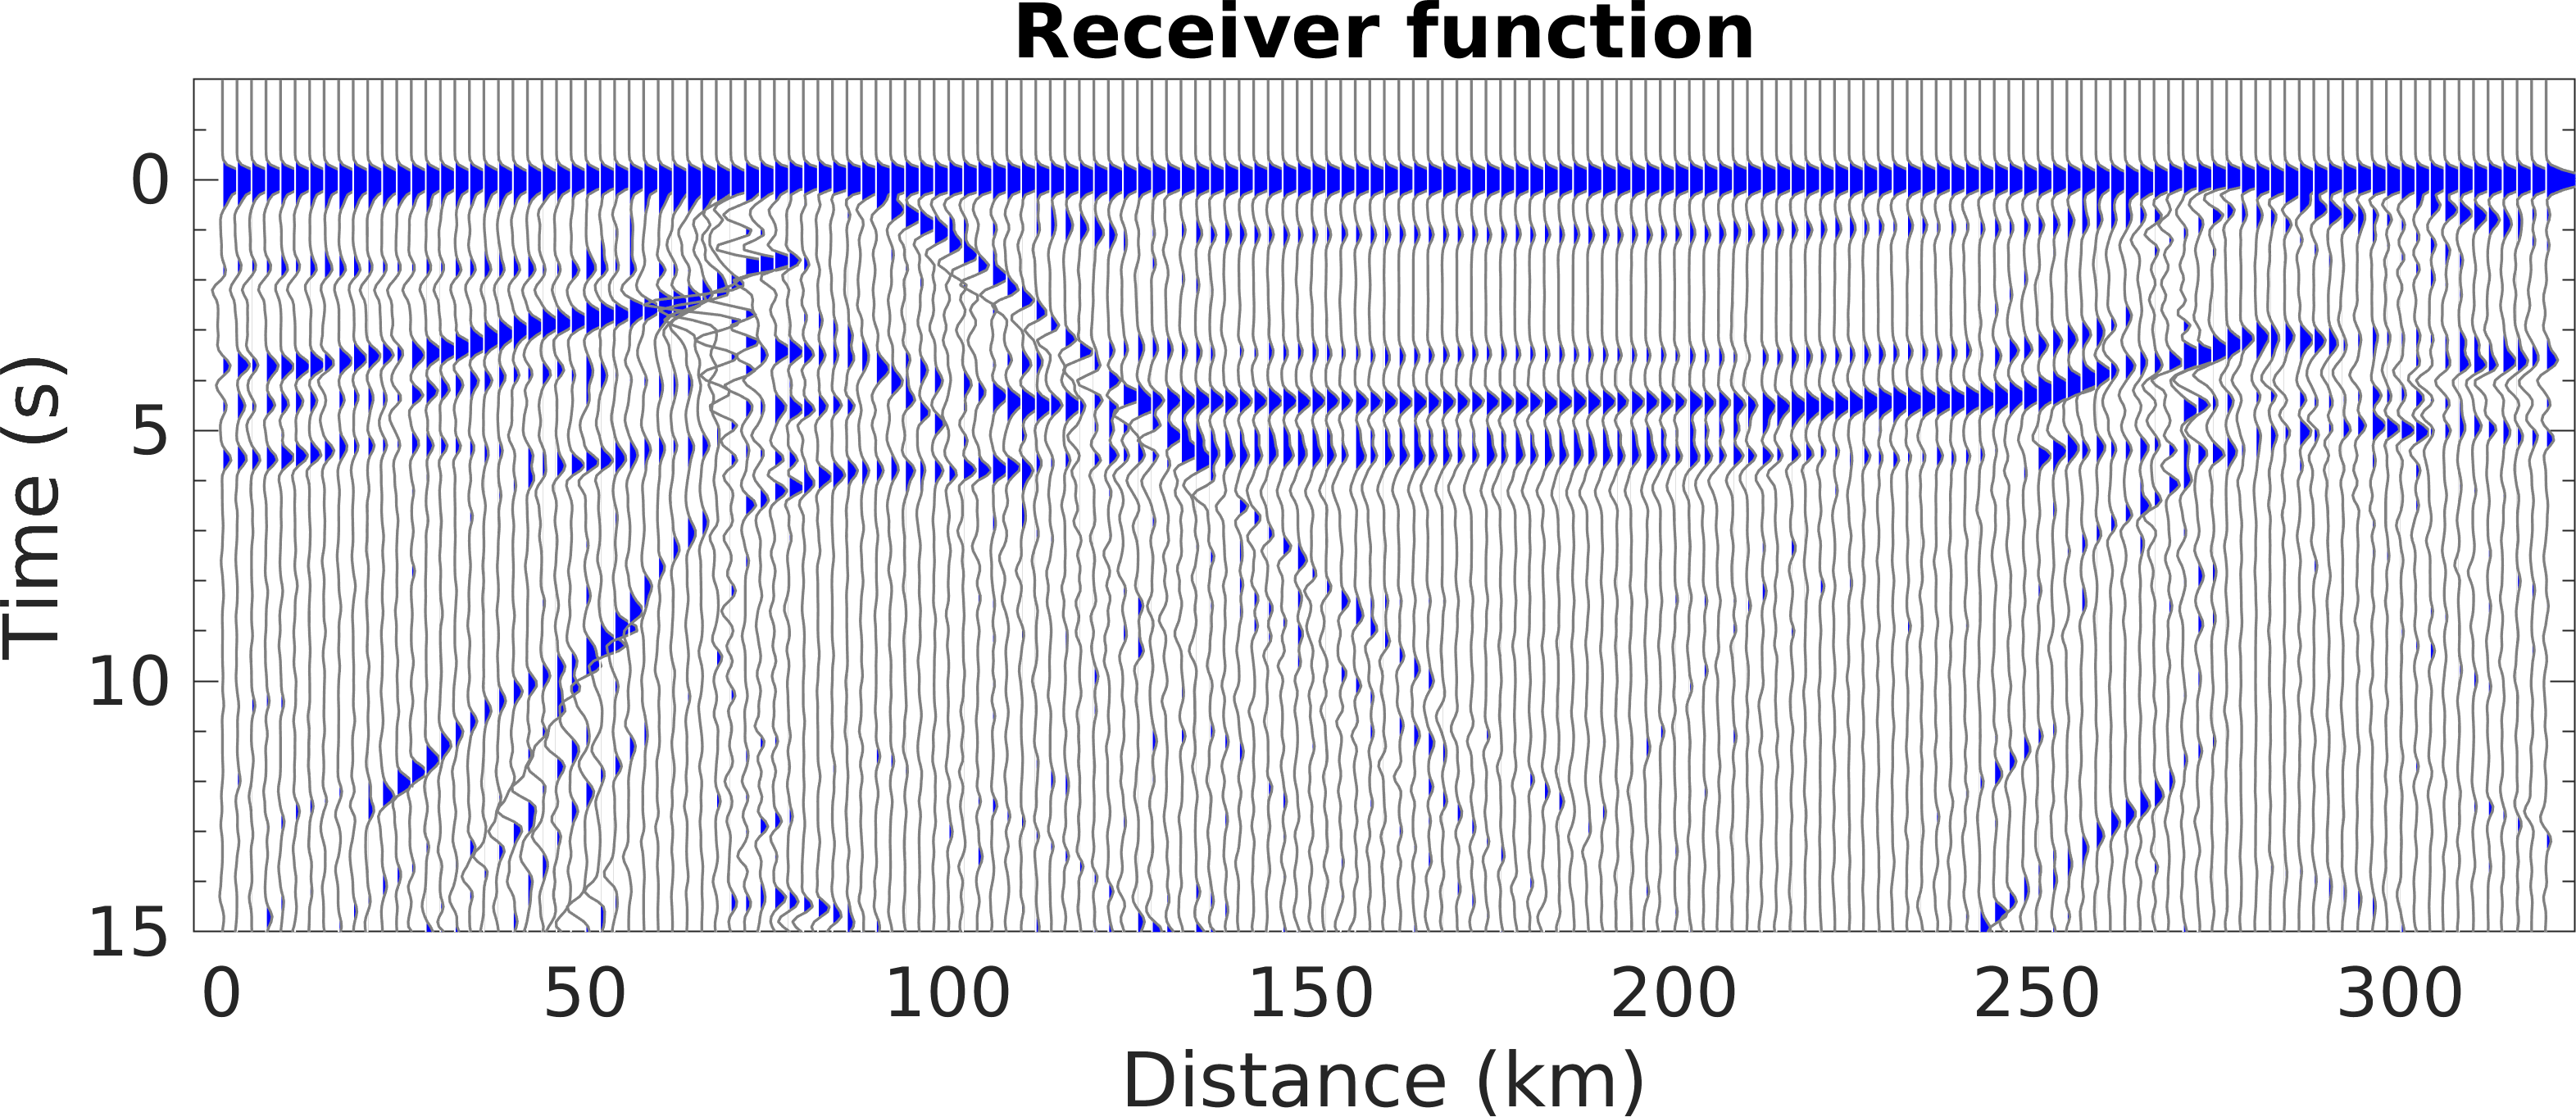
2. Receiver functions
We use FDFK (Liu et al., 2025) method to simulate teleseismic wavefields for the benchmark model. We generate ten teleseismic events in total.
3. Migration imaging
We perform migration imaging for the benchmark model.